Layers
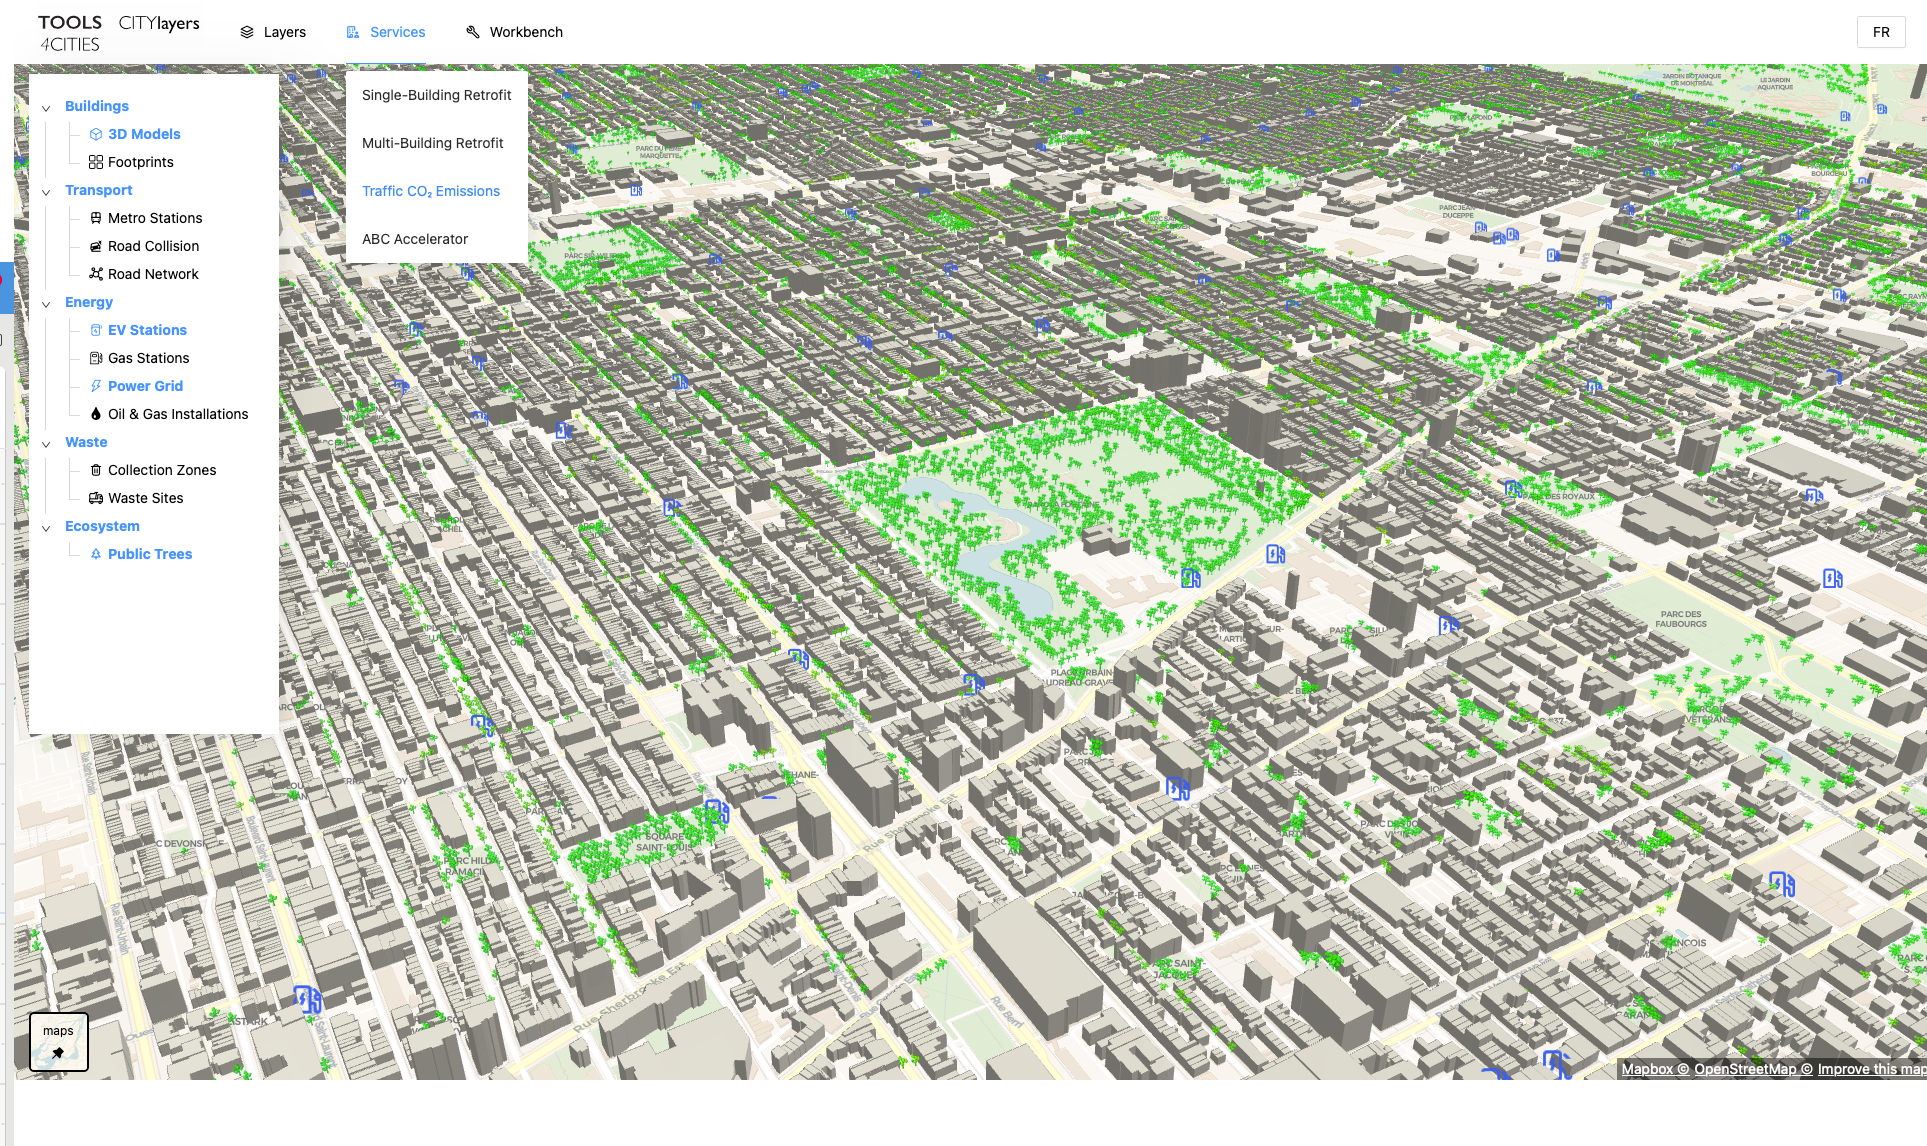
Clicking on ‘Layers’ in the top ribbon will bring in a tray from the left containing a list of all the datasets that can be visualized on the map. (This is a toggle so the tray can be removed again to maximize the display area for the map). The datasets are organized into major categories, with several sub-categories under each. At the time of writing, there are five major categories as follows:
Buildings (footprints and 3D models)
Transport (metro stations and road collision data)
Energy (EV charging stations, gas stations, power grid, oil, and gas installations)
Waste (collection zones and waste sites)
Ecosystem (public trees)
Each dataset has a radio button to determine if that layer is visualized or not. So, any combination of layers can be overlaid at the same time, allowing the user to see the spatial spread of the data and any correlations between the different layers. These are all publicly available datasets, and new datasets are added regularly.
Clicking on any visualized element within the map displays any metadata known about that element in a pop-up window. For example, clicking on a building will show its year of construction, height, primary usage, total floor area, and several other data points. Clicking on a tree shows its species and trunk diameter. Clicking on a power grid line shows its voltage.
Note
Note that clicking on the same element in different cities may yield different categories of metadata, as each depends on what datasets are publicly available for that city.