Multi-Building Retrofit Analysis
This service is designed for people responsible for managing large numbers of buildings who want to consider different retrofit strategies across the whole of their building stock. For example, a municipality considering all their publicly owned buildings, a large bank looking at all their branches, or a residential co-op organization.
The user is able to take the same three retrofit scenarios from the single-building service and apply them in different ways across their building stock, so defining a ‘retrofit strategy.’ For example, one strategy might apply deep retrofitting (R3) to older buildings in the stock and add HVAC and PV (R2) to the most recently constructed buildings, leaving all those in between untouched. The user can see the resulting energy consumption, CO2eq emissions, and life-cycle cost and how they compare to the status quo. The user can then create alternative strategies and compare them against each other to find the optimum one for their needs. All strategies can be saved within a ‘Project’ so the user can go back to them over time.
User Experience
Building Selection
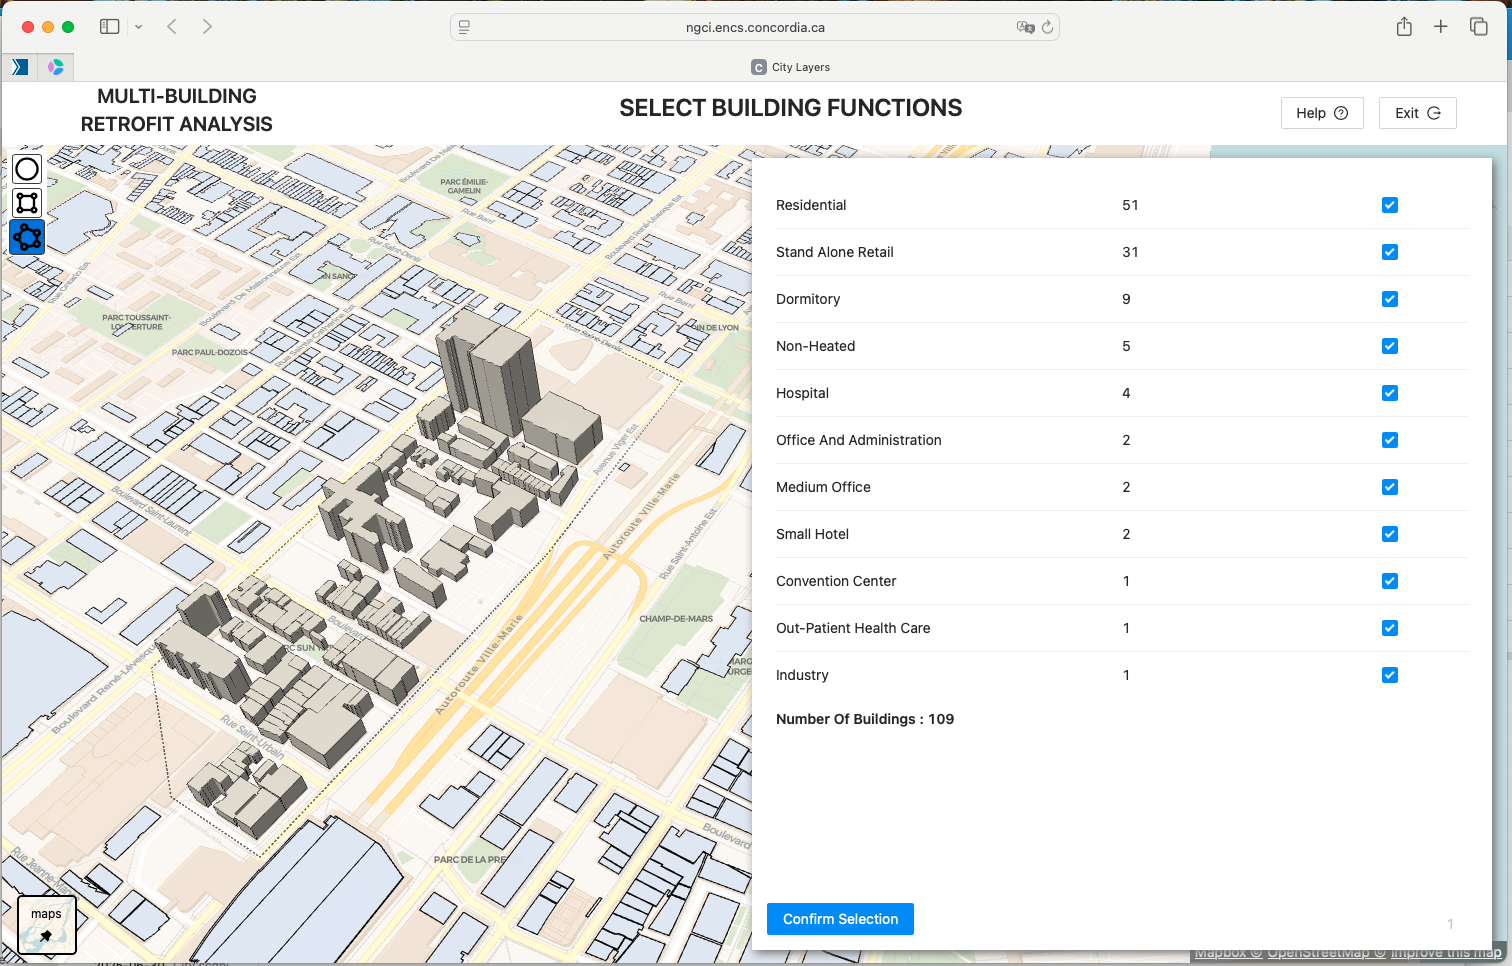
Use polygons to select areas of buildings and filter the selection based on building primary function
The first step when creating a multi-building retrofit analysis project is to select the building stock. In this screenshot, the user has defined a polygon around the streets surrounding Montreal’s Chinatown, and all the buildings within it are selected. Multiple polygons can be added to grow the selection to include groups of buildings from across the city. Selecting buildings by borough, neighborhood, or postcode are other selection possibilities that will be provided. Selecting individual buildings by clicking them to add them to the selection or to remove them from the selection is a further feature that will be added.
Once the buildings have been selected spatially, the user can then filter them by usage. All the distinct building usage categories, found in the polygon, appear in the panel, along with their count. The check-boxes beside each one are all checked by default, indicating that all building usages are being included. The user can uncheck any building usage they do not want to include in their retrofit strategy. A running total of the number of buildings is also displayed. Once the user is finally happy with their selection, they click on the ‘Confirm Selection’ button to continue.
Energy Data Analysis
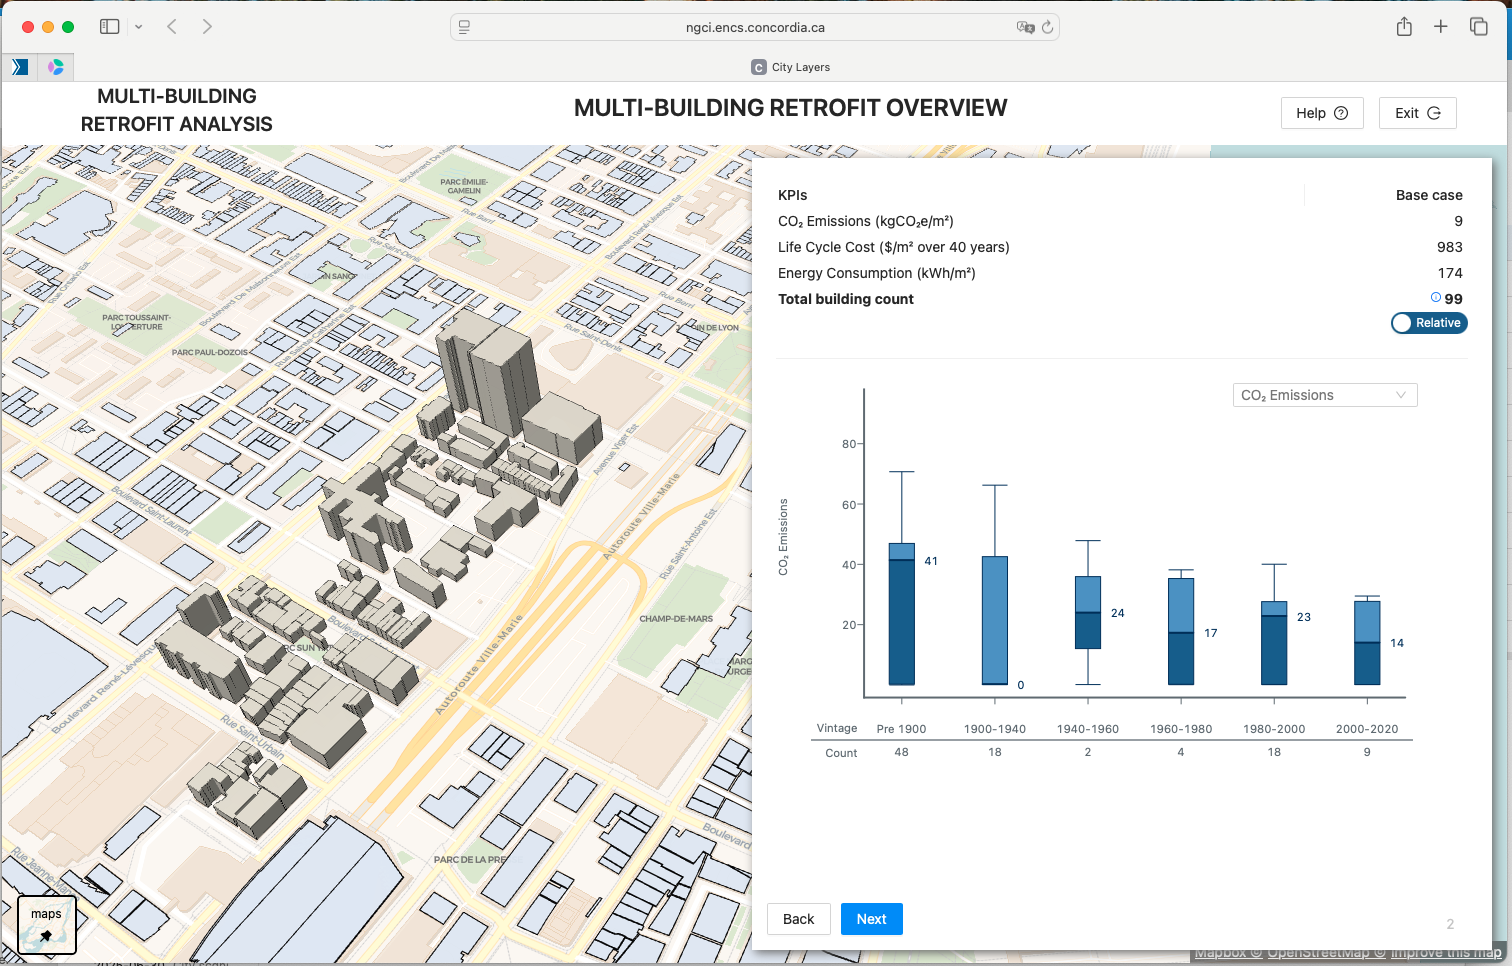
Understand the simulated CO2 emissions, energy consumption, and life cycle energy costs of buildings by vintage
The user will then see the base case metrics for the buildings: the cumulative annual CO2eq emissions, energy consumption, and life-cycle cost. To understand how these metrics are distributed amongst the buildings, there are box plots with building vintages (age ranges) along the x-axis and one of the three metrics on the y-axis. The user can select which metric they want to analyze. The box plot shows the locality, spread, and skewness of each metric within all the buildings of a given vintage. It is easy to see how the buildings cluster between the 25th and 75th percentile and also the extent to which there are outliers above and below the average. It is expected that this base case analysis will inform the process of creating retrofit strategies.
Define Retrofit Strategy
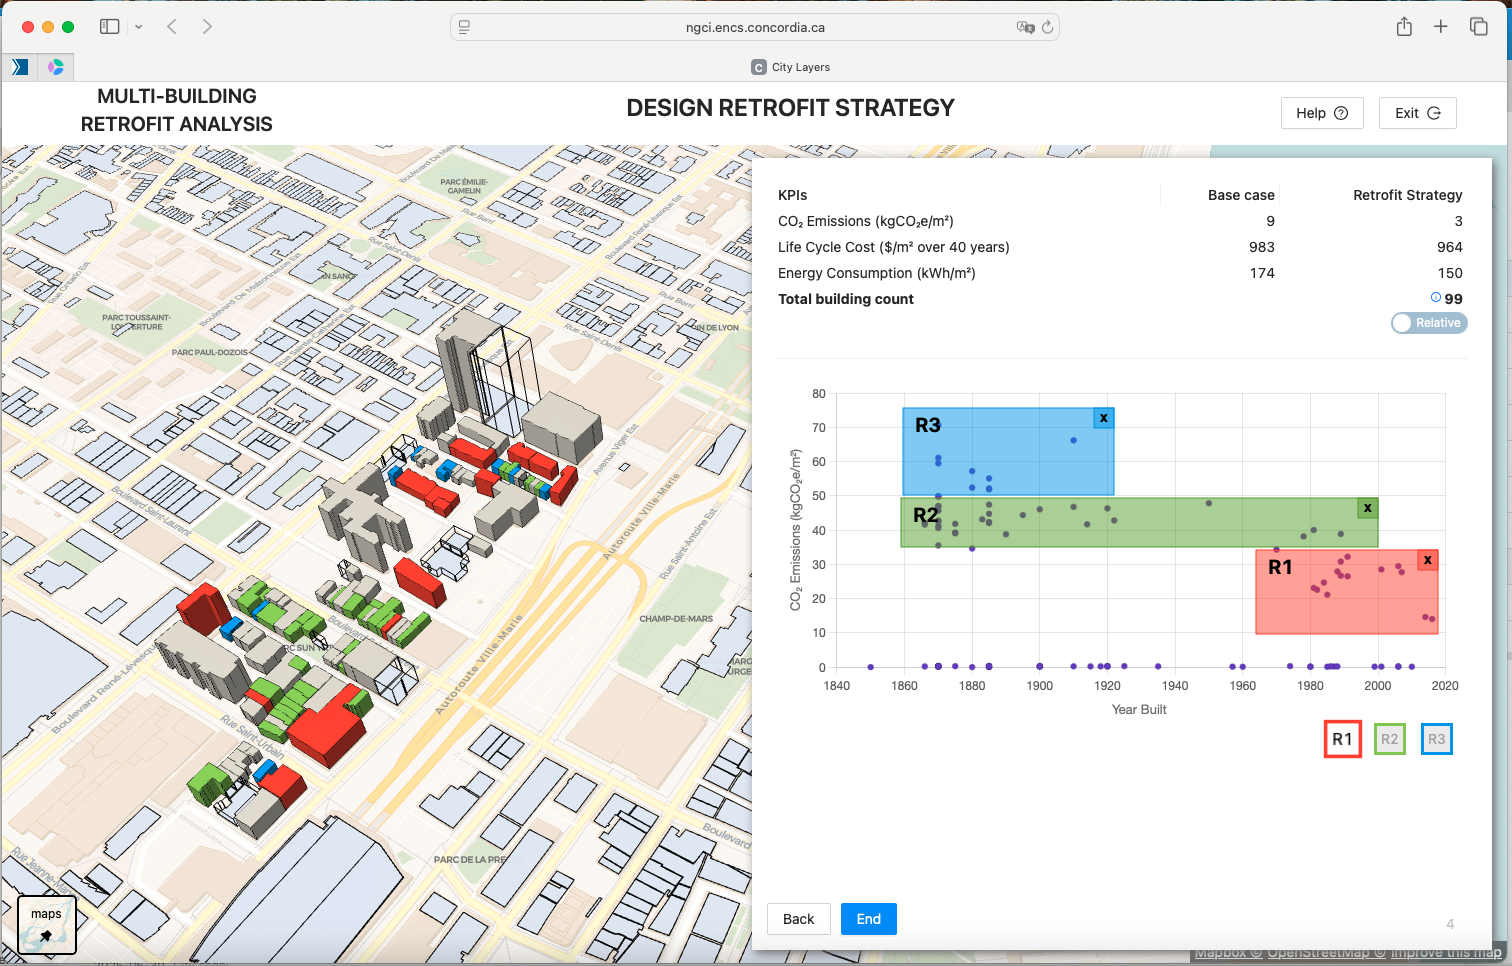
Define retrofit strategy by applying R0, R1 and R2 to subsets of the buildings
The screenshot above shows the panel for creating a retrofit strategy. All the buildings in the selection are plotted on a graph with their year of construction along the x-axis and either CO2eq, energy consumption, or life-cycle cost, along the y-axis (the user chooses which one). On the top right, there are three colored buttons for the retrofit scenarios: R1, R2, and R3. Clicking on one of these creates a labeled, color-coordinated rectangle on the graph itself. All the buildings inside the rectangle will be retrofitted using that scenario. The rectangle is editable, so it can be moved and stretched around the graph to encompass whichever range of buildings the user desires. Multiple rectangles of the same retrofit scenario can be created so it can be applied to non-contiguous groups of buildings on the graph. All buildings that lie outside of the rectangles are presumed not to be retrofitted. In this way, the user creates a retrofit strategy.
As each rectangle is added (or removed) there will be a real-time update of the cumulative annual metrics for the buildings so the user gets immediate feedback on the effectiveness of the strategy. (This readout is not included in the illustration).
Once the user is happy with their strategy, they can name it and save it in their project. The real power of this tool is the ability to compare strategies side-by-side. Figure 8 shows an example of five different strategies compared to each other and also compared to the base case. Users can create strategies to favor emissions, costs, or energy consumption, prioritizing different vintages of the building stock and then comparing to make a better-informed decision on which way to go. This could help inform municipal policy decisions, property developer investment decisions, or other high-level strategic thinking around retrofitting a large number of buildings.
Methodolgy
An explanation of the building energy modelling methodology (archetypes)
All the specific datasets used as inputs to the model (links to them?)
All assumptions for R0,R1,R2,R3
Links to relevant papers