RETROfitter
RETROfitter is written in C# using the UNITY game engine to provide a highly responsive and interactive 3D experience (video below). It is an application that is downloaded to a user’s PC or MAC (as opposed to CITYlayers, which runs in a browser). It connects to the CITYhub via the Dompark API to source all the catalogs of retrofit-related information and to run the energy modeling in real time based on the users’ choices.
Building Viewer
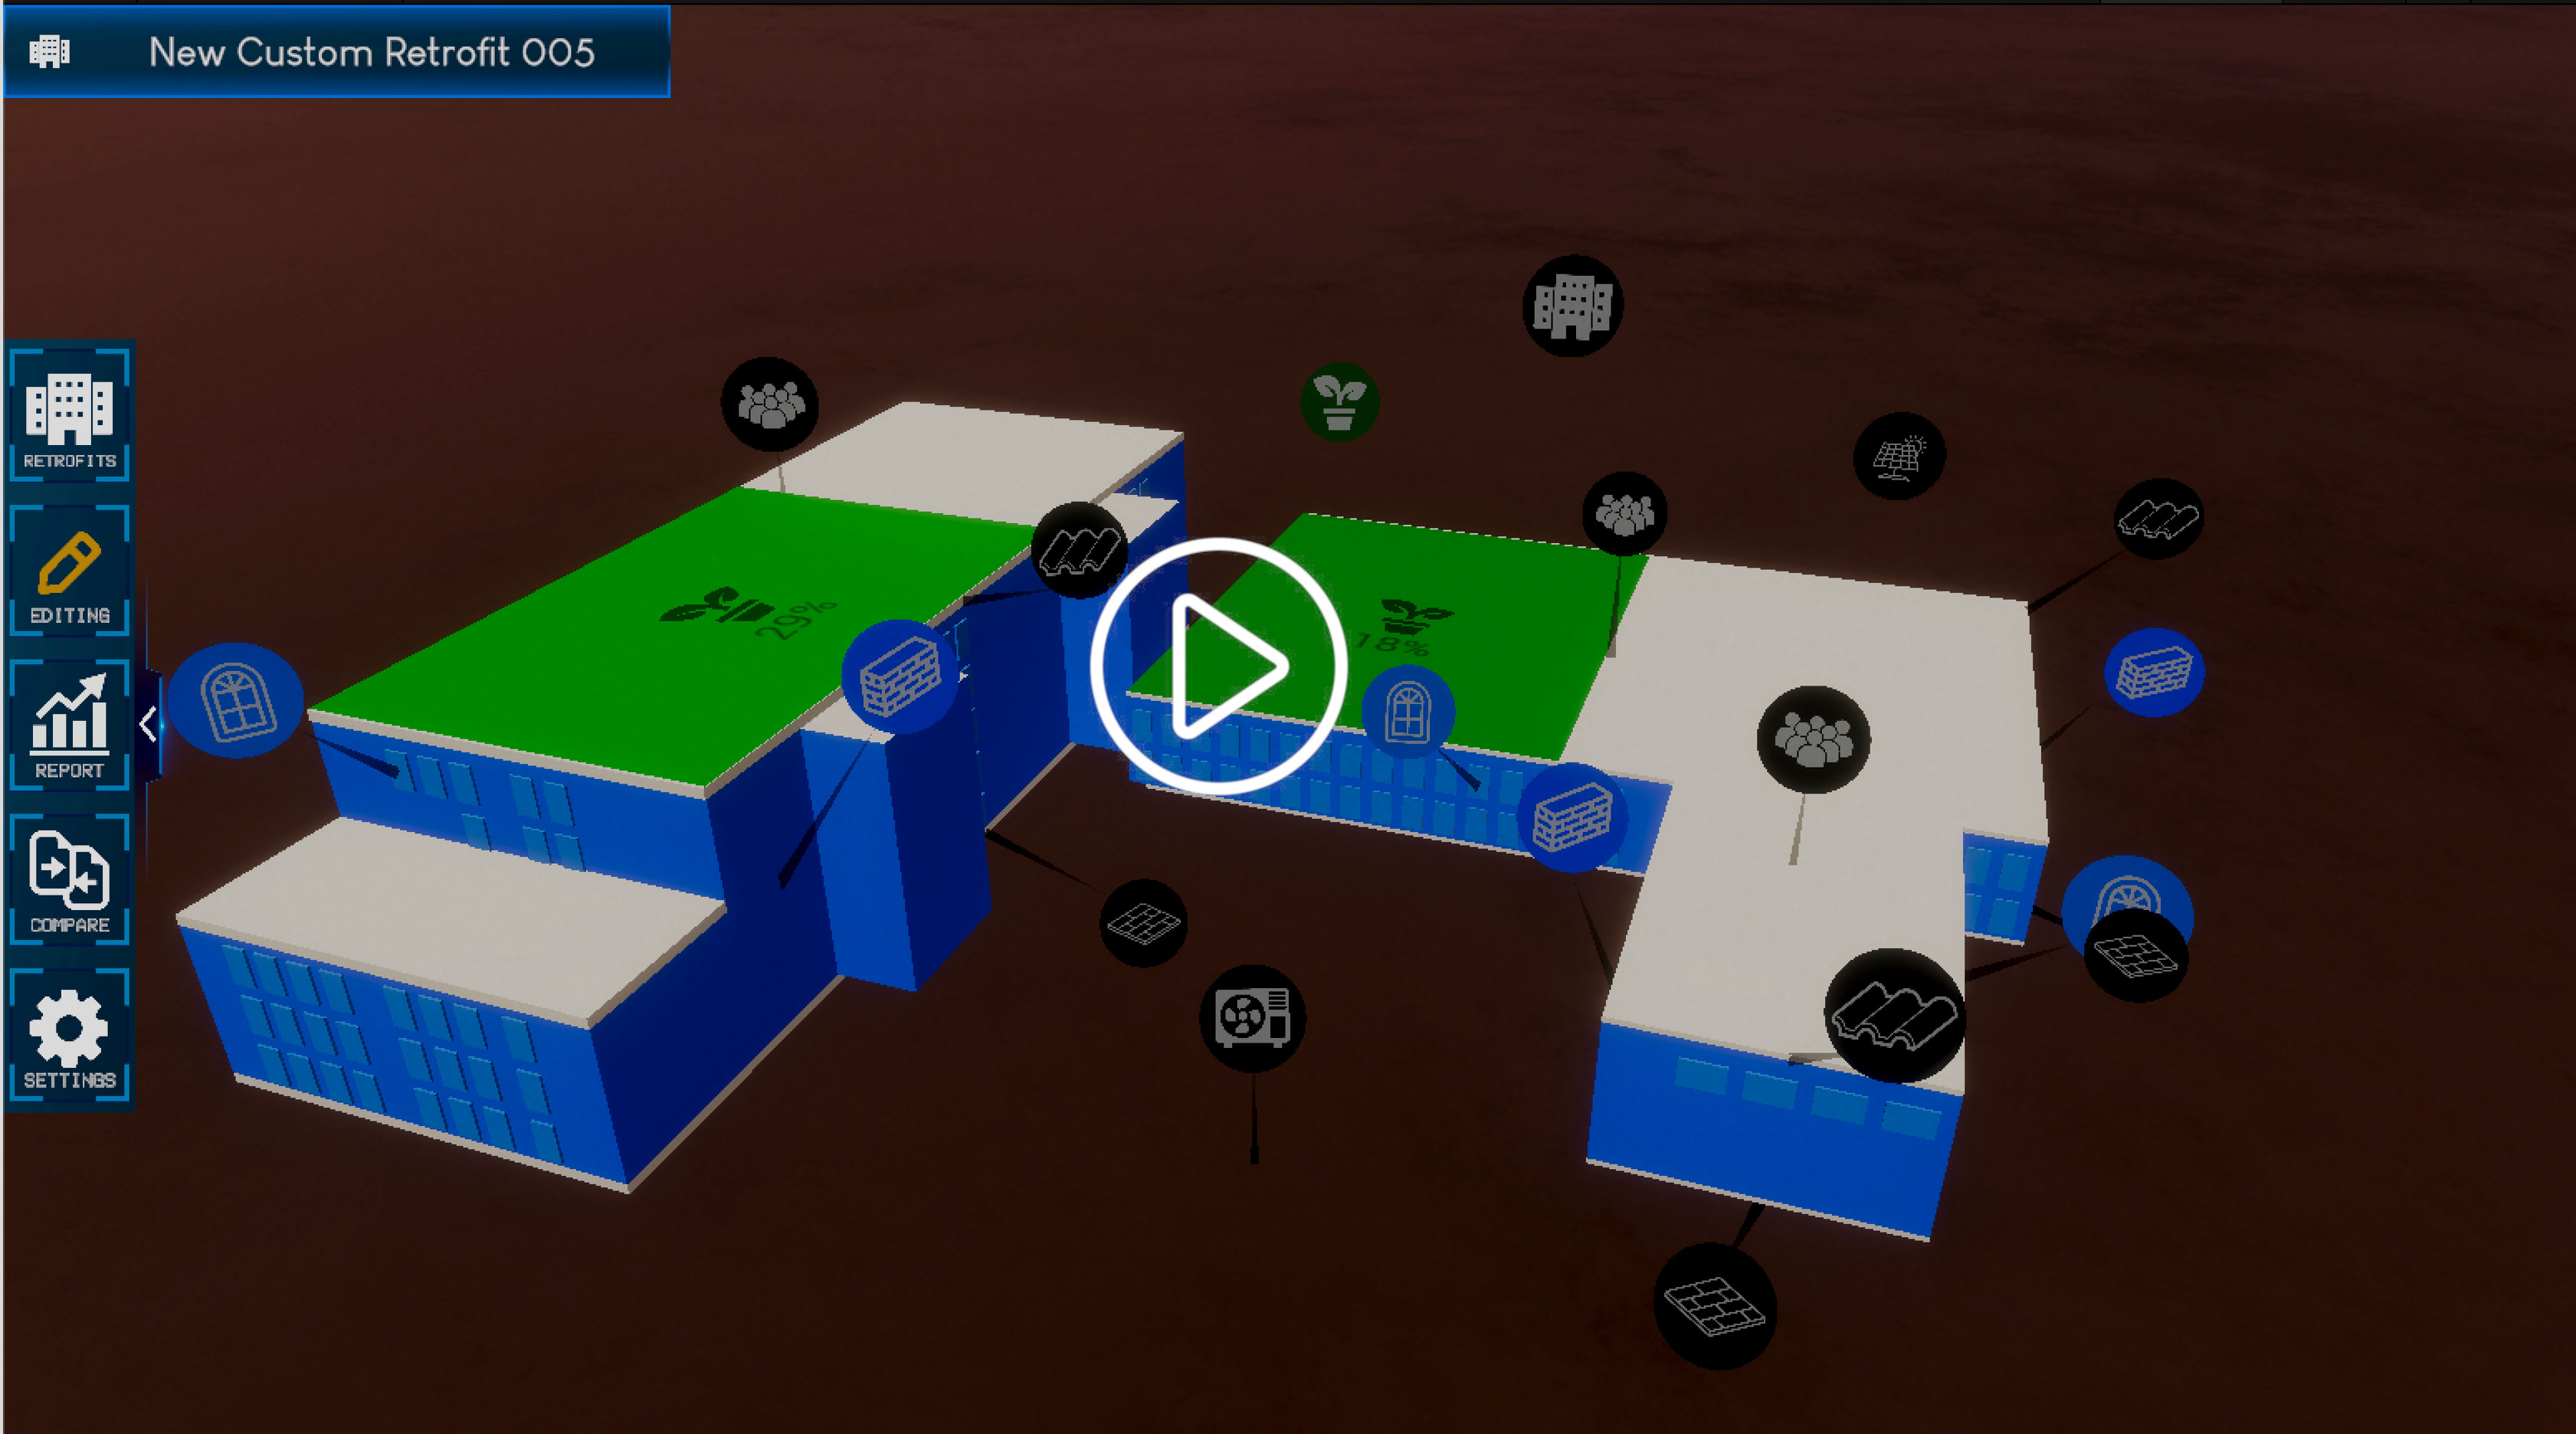
The user first loads up a simple abstraction of their building’s outer surface (envelope). In the prototype, there is a pre-loaded building geometry based on the Dompark building in Lachine, Montreal, but in the final software the user would upload the geometry in one of several standard and accepted formats (for example, cityGML). The building can then be viewed in 3D, using the mouse to fly around the exterior, and at once, the key parts of the envelope that are modifiable are highlighted, namely each wall, roof, floor, and window. A system of bubbles and icons is used for this. Clicking on any of these bubbles zooms into that element and displays the current construction information. A second click on the edit icon switches to the configuration screen, where the catalog of options for that element can be seen.
There are three more bubbles referring to the building that can be selected: Heat pumps, Usage, and PV. These each have their own configuration screens too.
The envelope of the building is rendered using a palette of blues. Blue indicates that this part of the envelope has not been modified. As the user opts to change walls, roofs, floors, and windows for more energy-efficient materials, so they appear on the 3D rendering with distinct colors. If PV is added to roofs, the % of coverage is colored in on the relevant rooftop. If a heat pump is added, a heat pump model appears. Finally, if the building usage is modified, the usage bubble changes color. This visual language allows the user to see at a glance which elements of their building have been modified in this retrofit scenario and which remain unchanged.
Configuration Screens
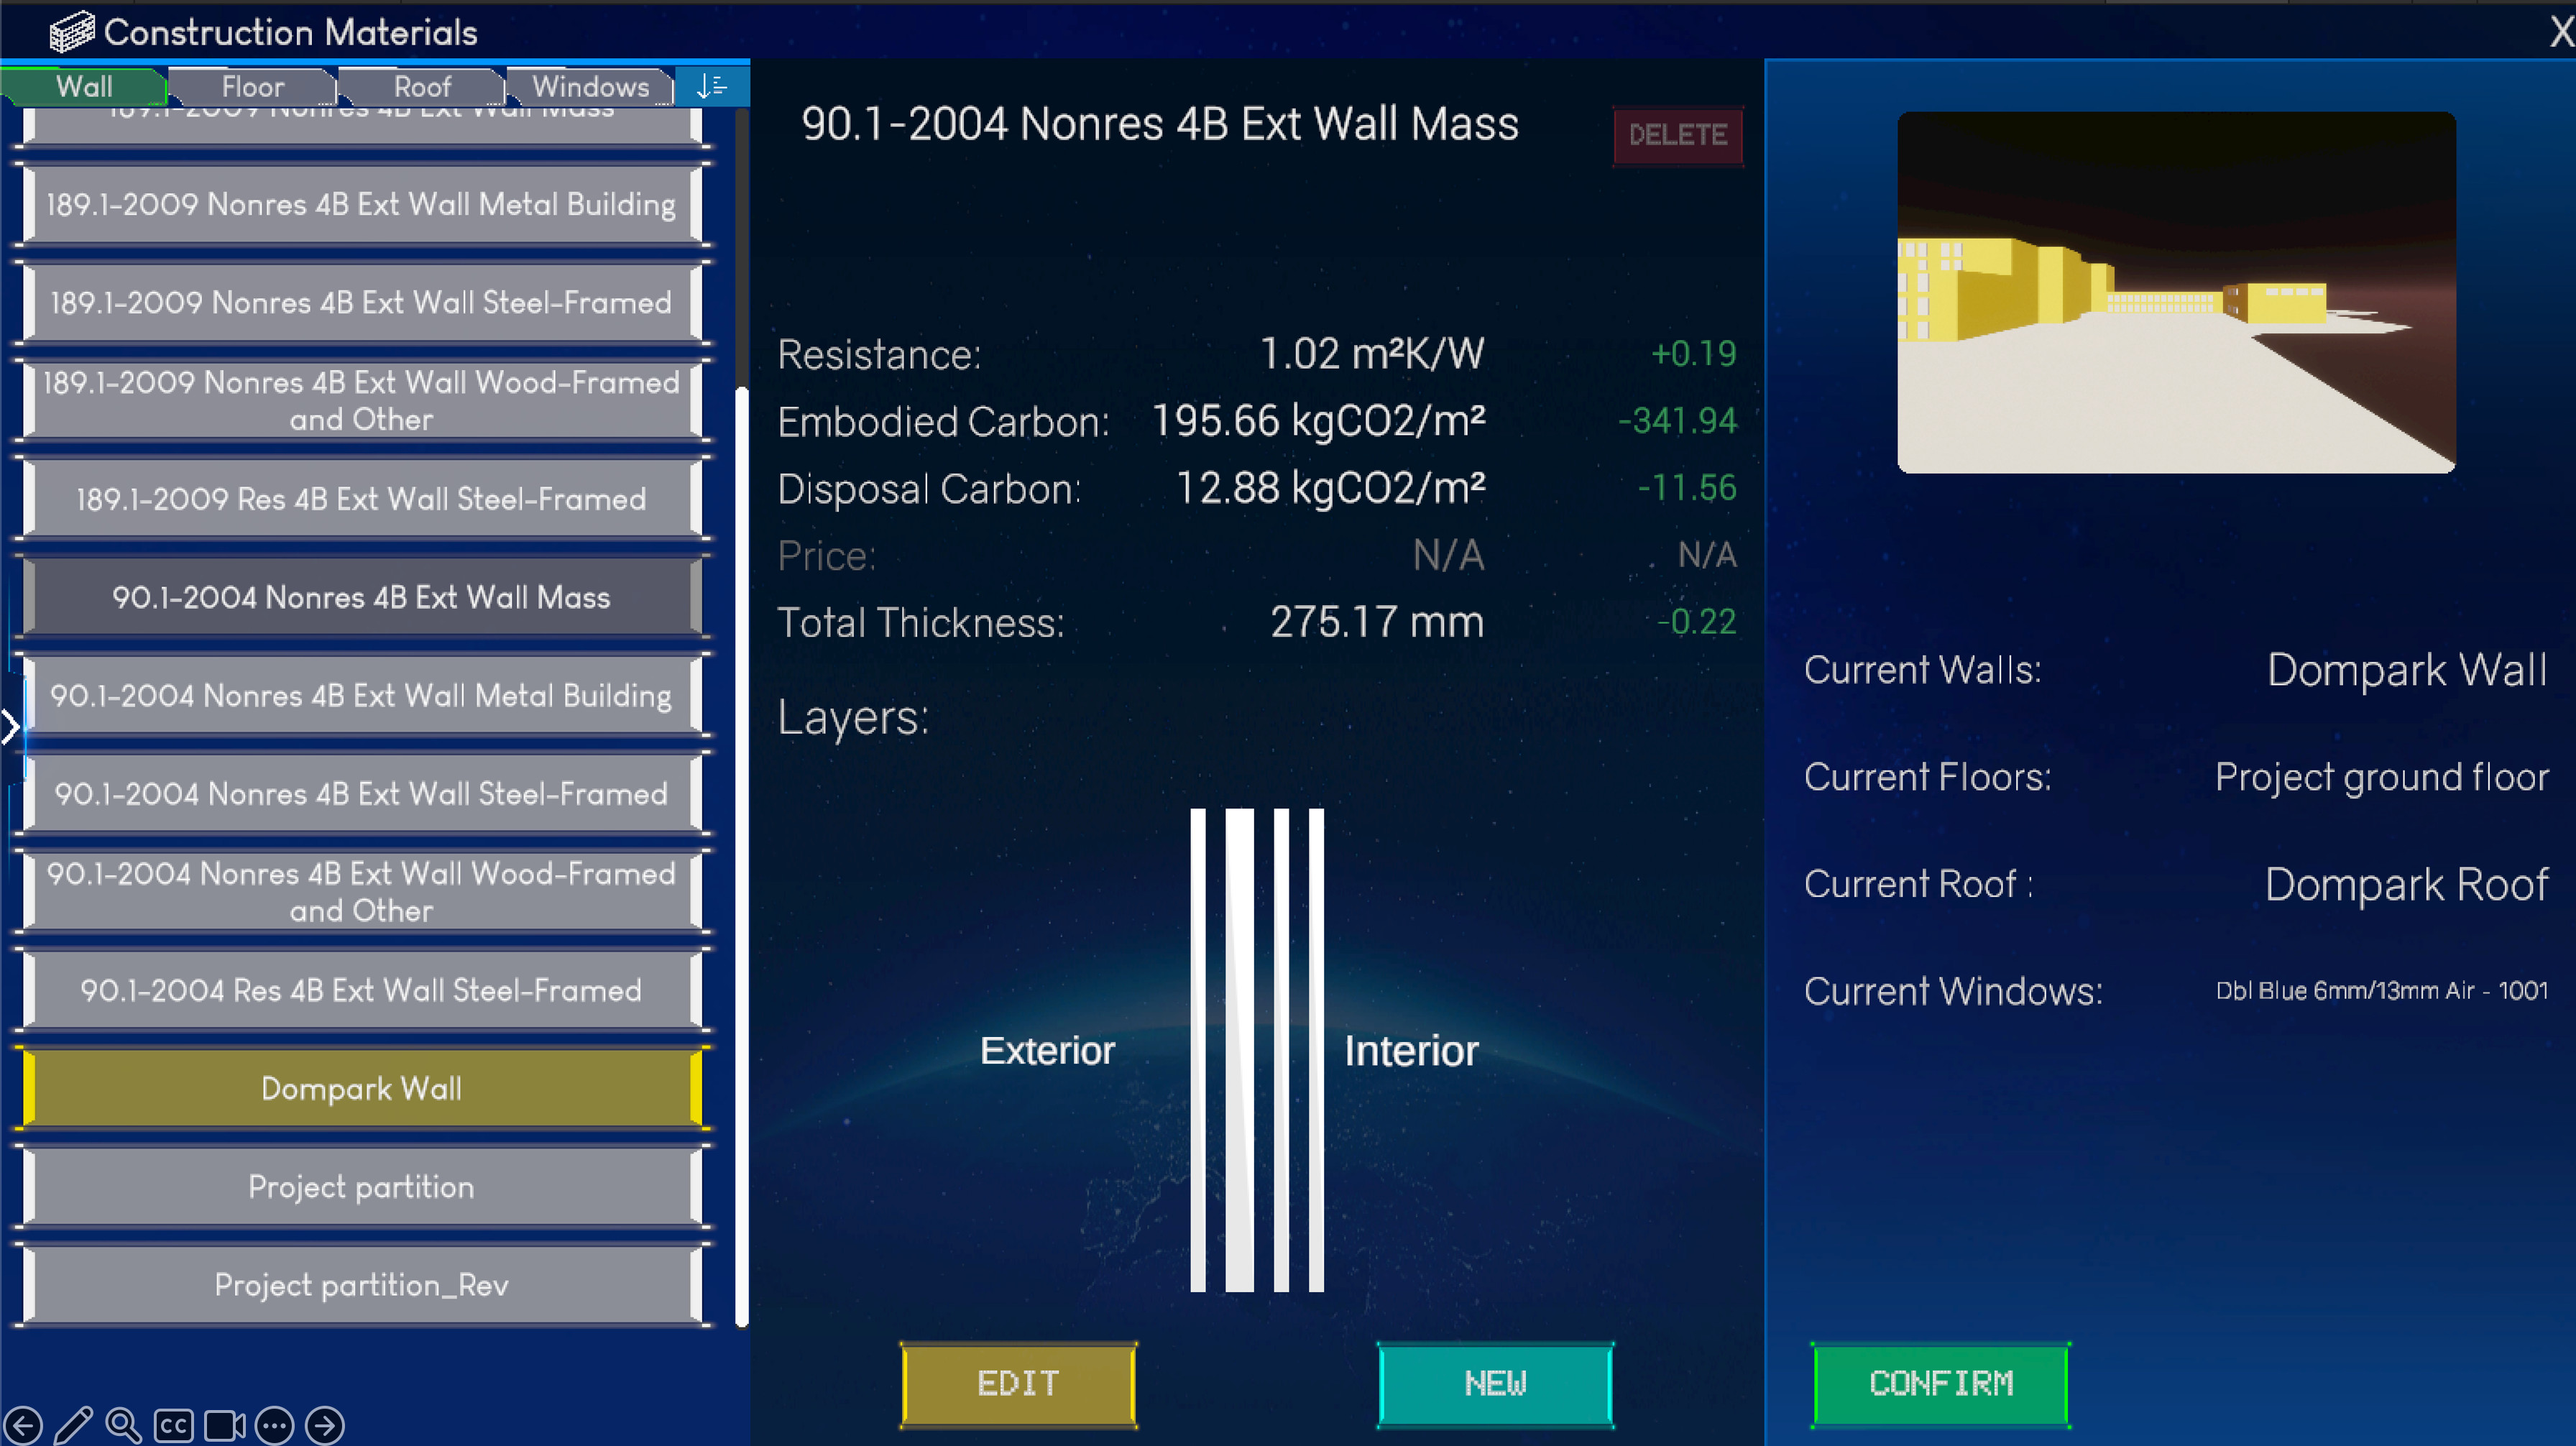
Real-time editting of the construction layers in the walls and floor.
Walls / Floors / Roofs The configuration screen for walls, floors, and roofs has two main components: the catalog of available constructions (imported from the HUB) and a visual schematic representation of the number of layers in that construction. The construction catalog is a set of industry-recognized constructions for North American buildings. A construction is defined by a series of layers, a material for each layer, and a thickness of each layer. The thermal properties of each construction are shown. Each catalog is provided by the CITYhub at runtime, so any revisions or extensions of these catalogs made in the future will automatically be provided to RETROfitter without the need to re-download the app. The user can switch any wall, roof, or floor to use a different construction, and the difference in thermal properties between that and the current construction is displayed, with numbers in red indicating lower energy efficiency and green indicating higher energy efficiency.
The user can go one step further and create their own custom constructions. This involves defining how many layers they would like and giving a material to each layer. The construction materials are another part of the construction catalog, divided into materials suited to walls, roofs, and floors. Each material has its thermal properties and embedded and end-of-life CO₂eq emissions by weight.
Windows The windows catalog is another North American standard, with common materials and constructions used for windows in cities. Each window construction has information on its thermal properties, and the user can select any window construction for the windows in their building.
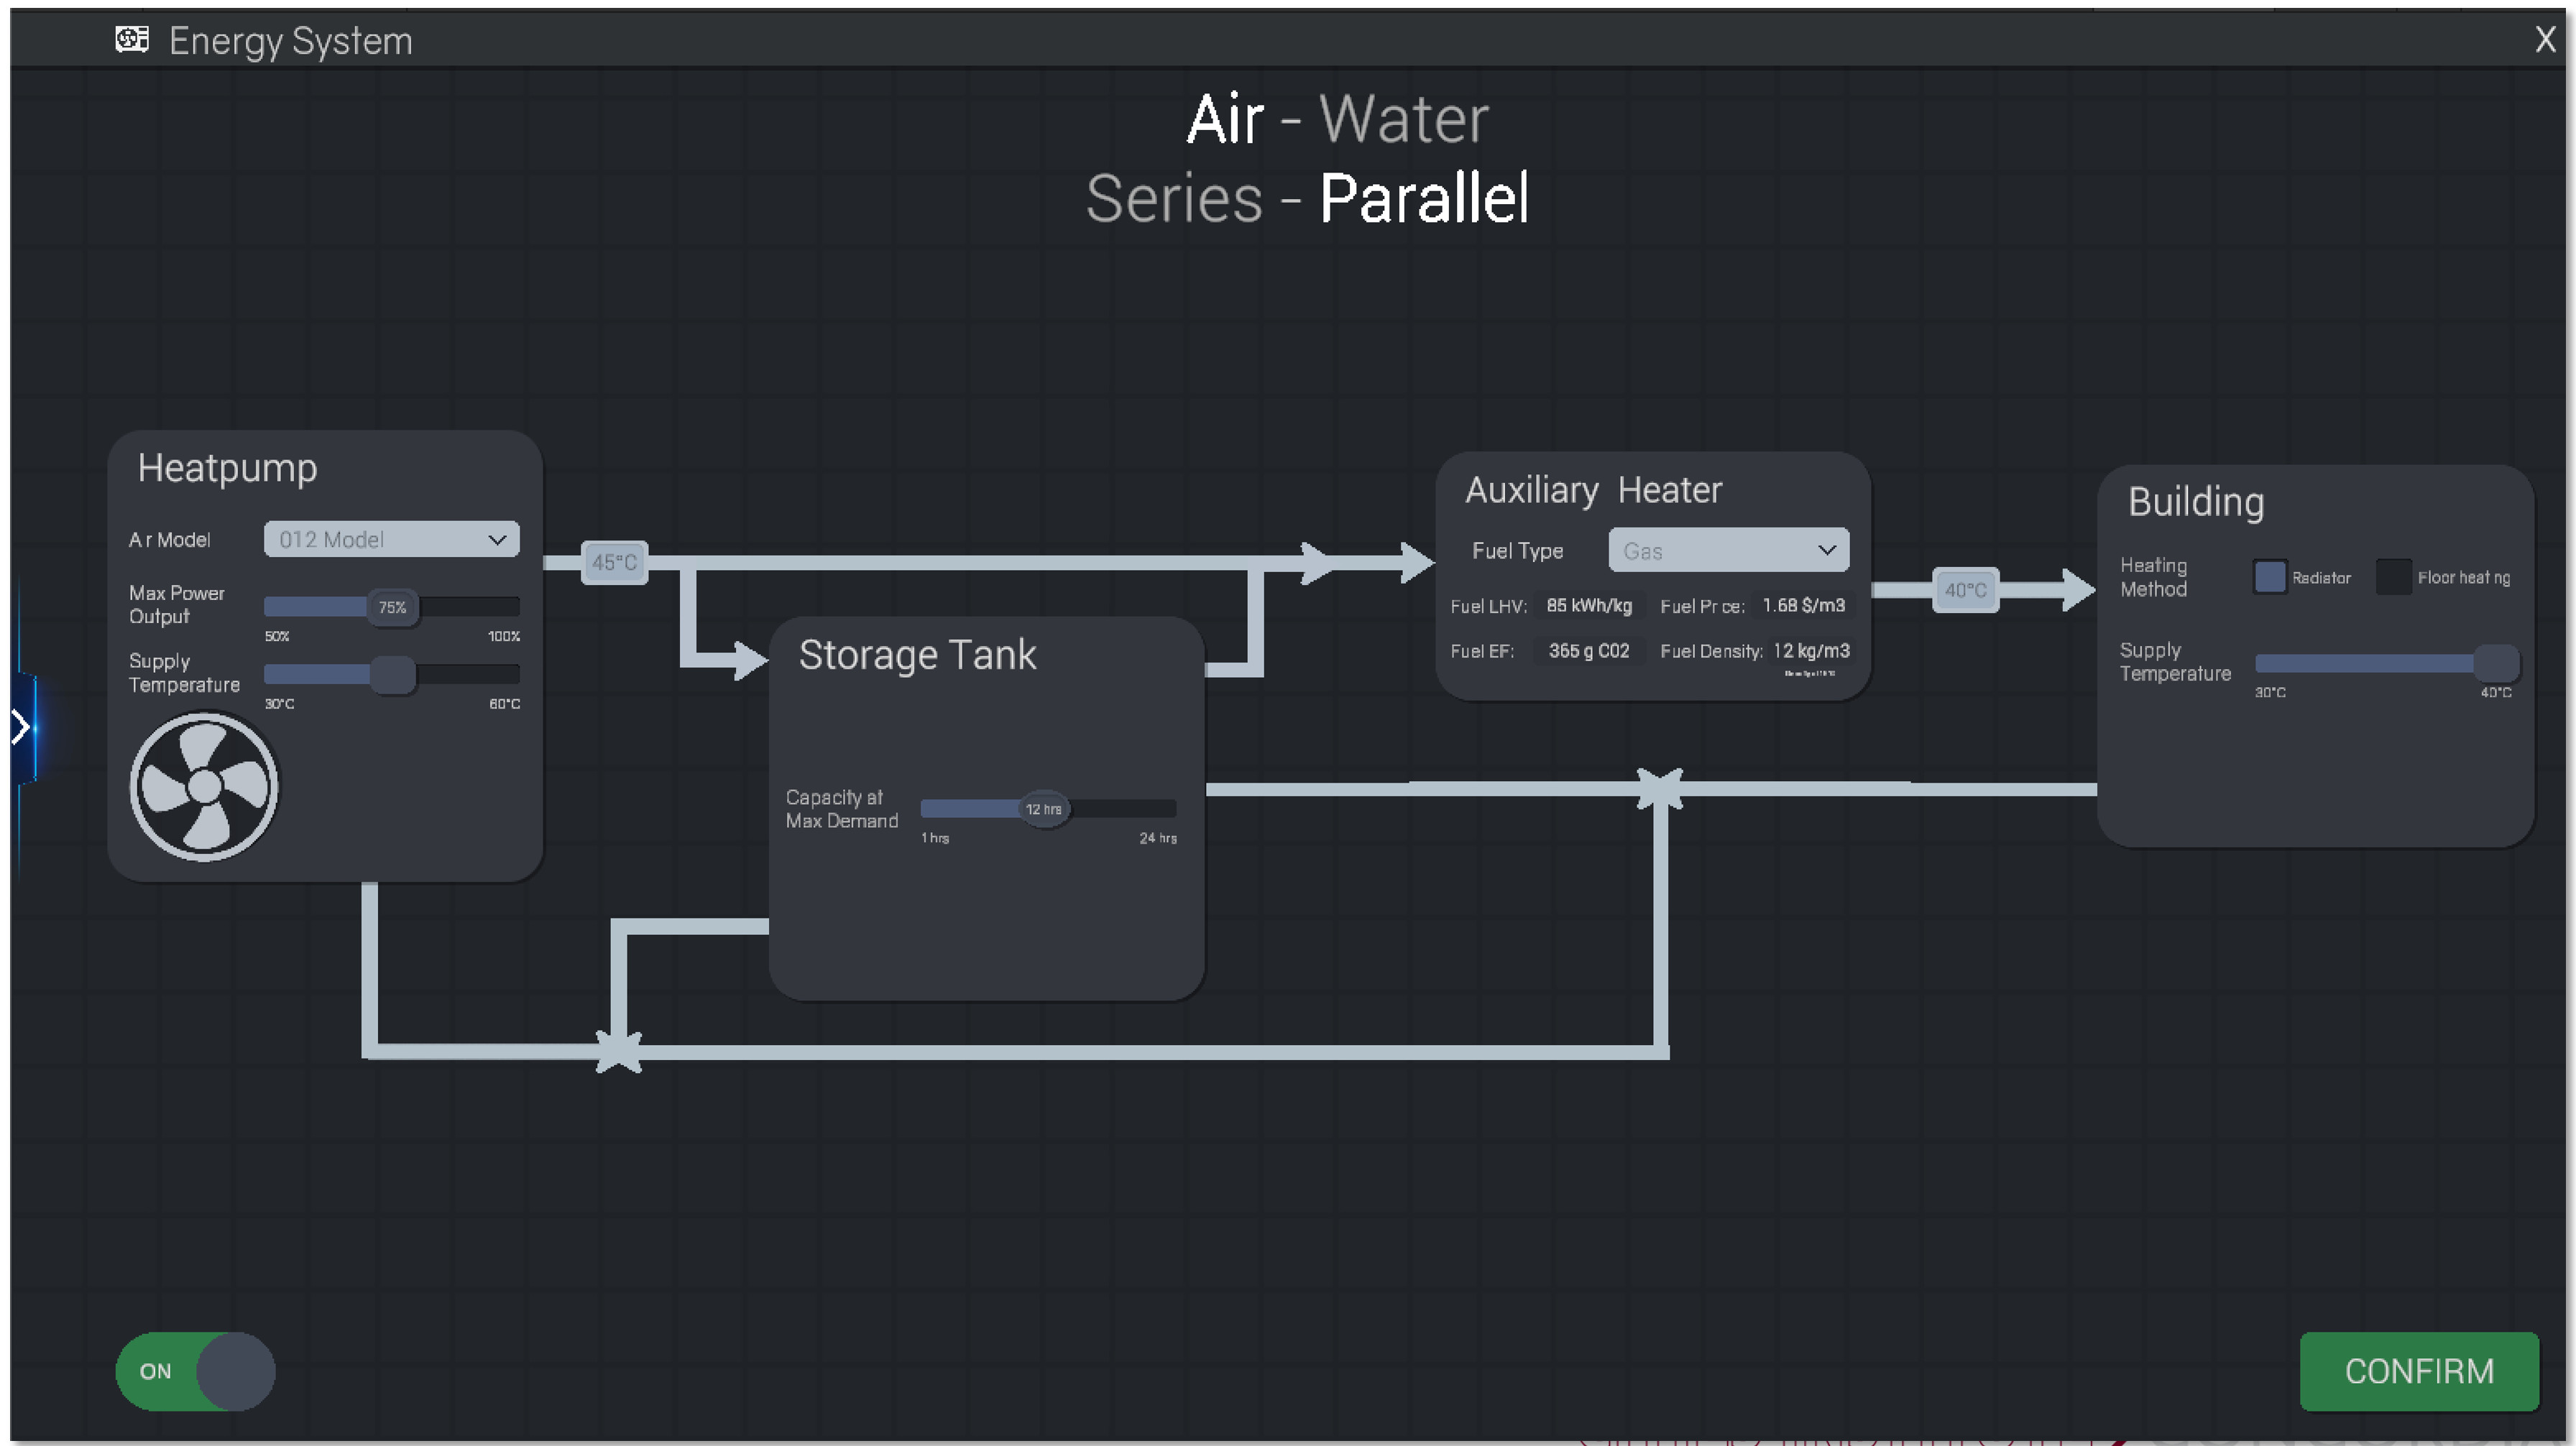
Configure the choice of heatpump system
Heat Pumps This screen uses a schematic 2D layout for a heat pump system, which shows each element (the heat source, the pump, storage, flow, and auxiliary heat source) and how they are connected together. There is also a drop-down menu to select the heat pump type (water, air, geothermal). The parameters for each component (e.g., set-point temperatures and capacities) appear directly on the components themselves and can be edited. Combining the parameters with a visual representation of the components and how they are arranged makes the configuration process very intuitive.
Building Usage This configuration screen displays a catalog of recognized North American building usages and a system of sliders for all the usages that take place in the building. The user can add or remove usages, and sliders for them appear/disappear accordingly. The sliders can be moved to adjust the % of each usage expected within the building. All %’s must sum to 100%, so moving increasing one slider will decrease all the rest. The user is able to ‘lock’ any of the sliders in place so their % remains fixed even when another slider is being changed.
Rooftop PV This configuration screen shows all the roofs of the building in a top-down view. The user can select any roof and then increase/decrease the % of PV that is to be placed on that roof. The efficiency of the PV can also be chosen.
Simulation Screen
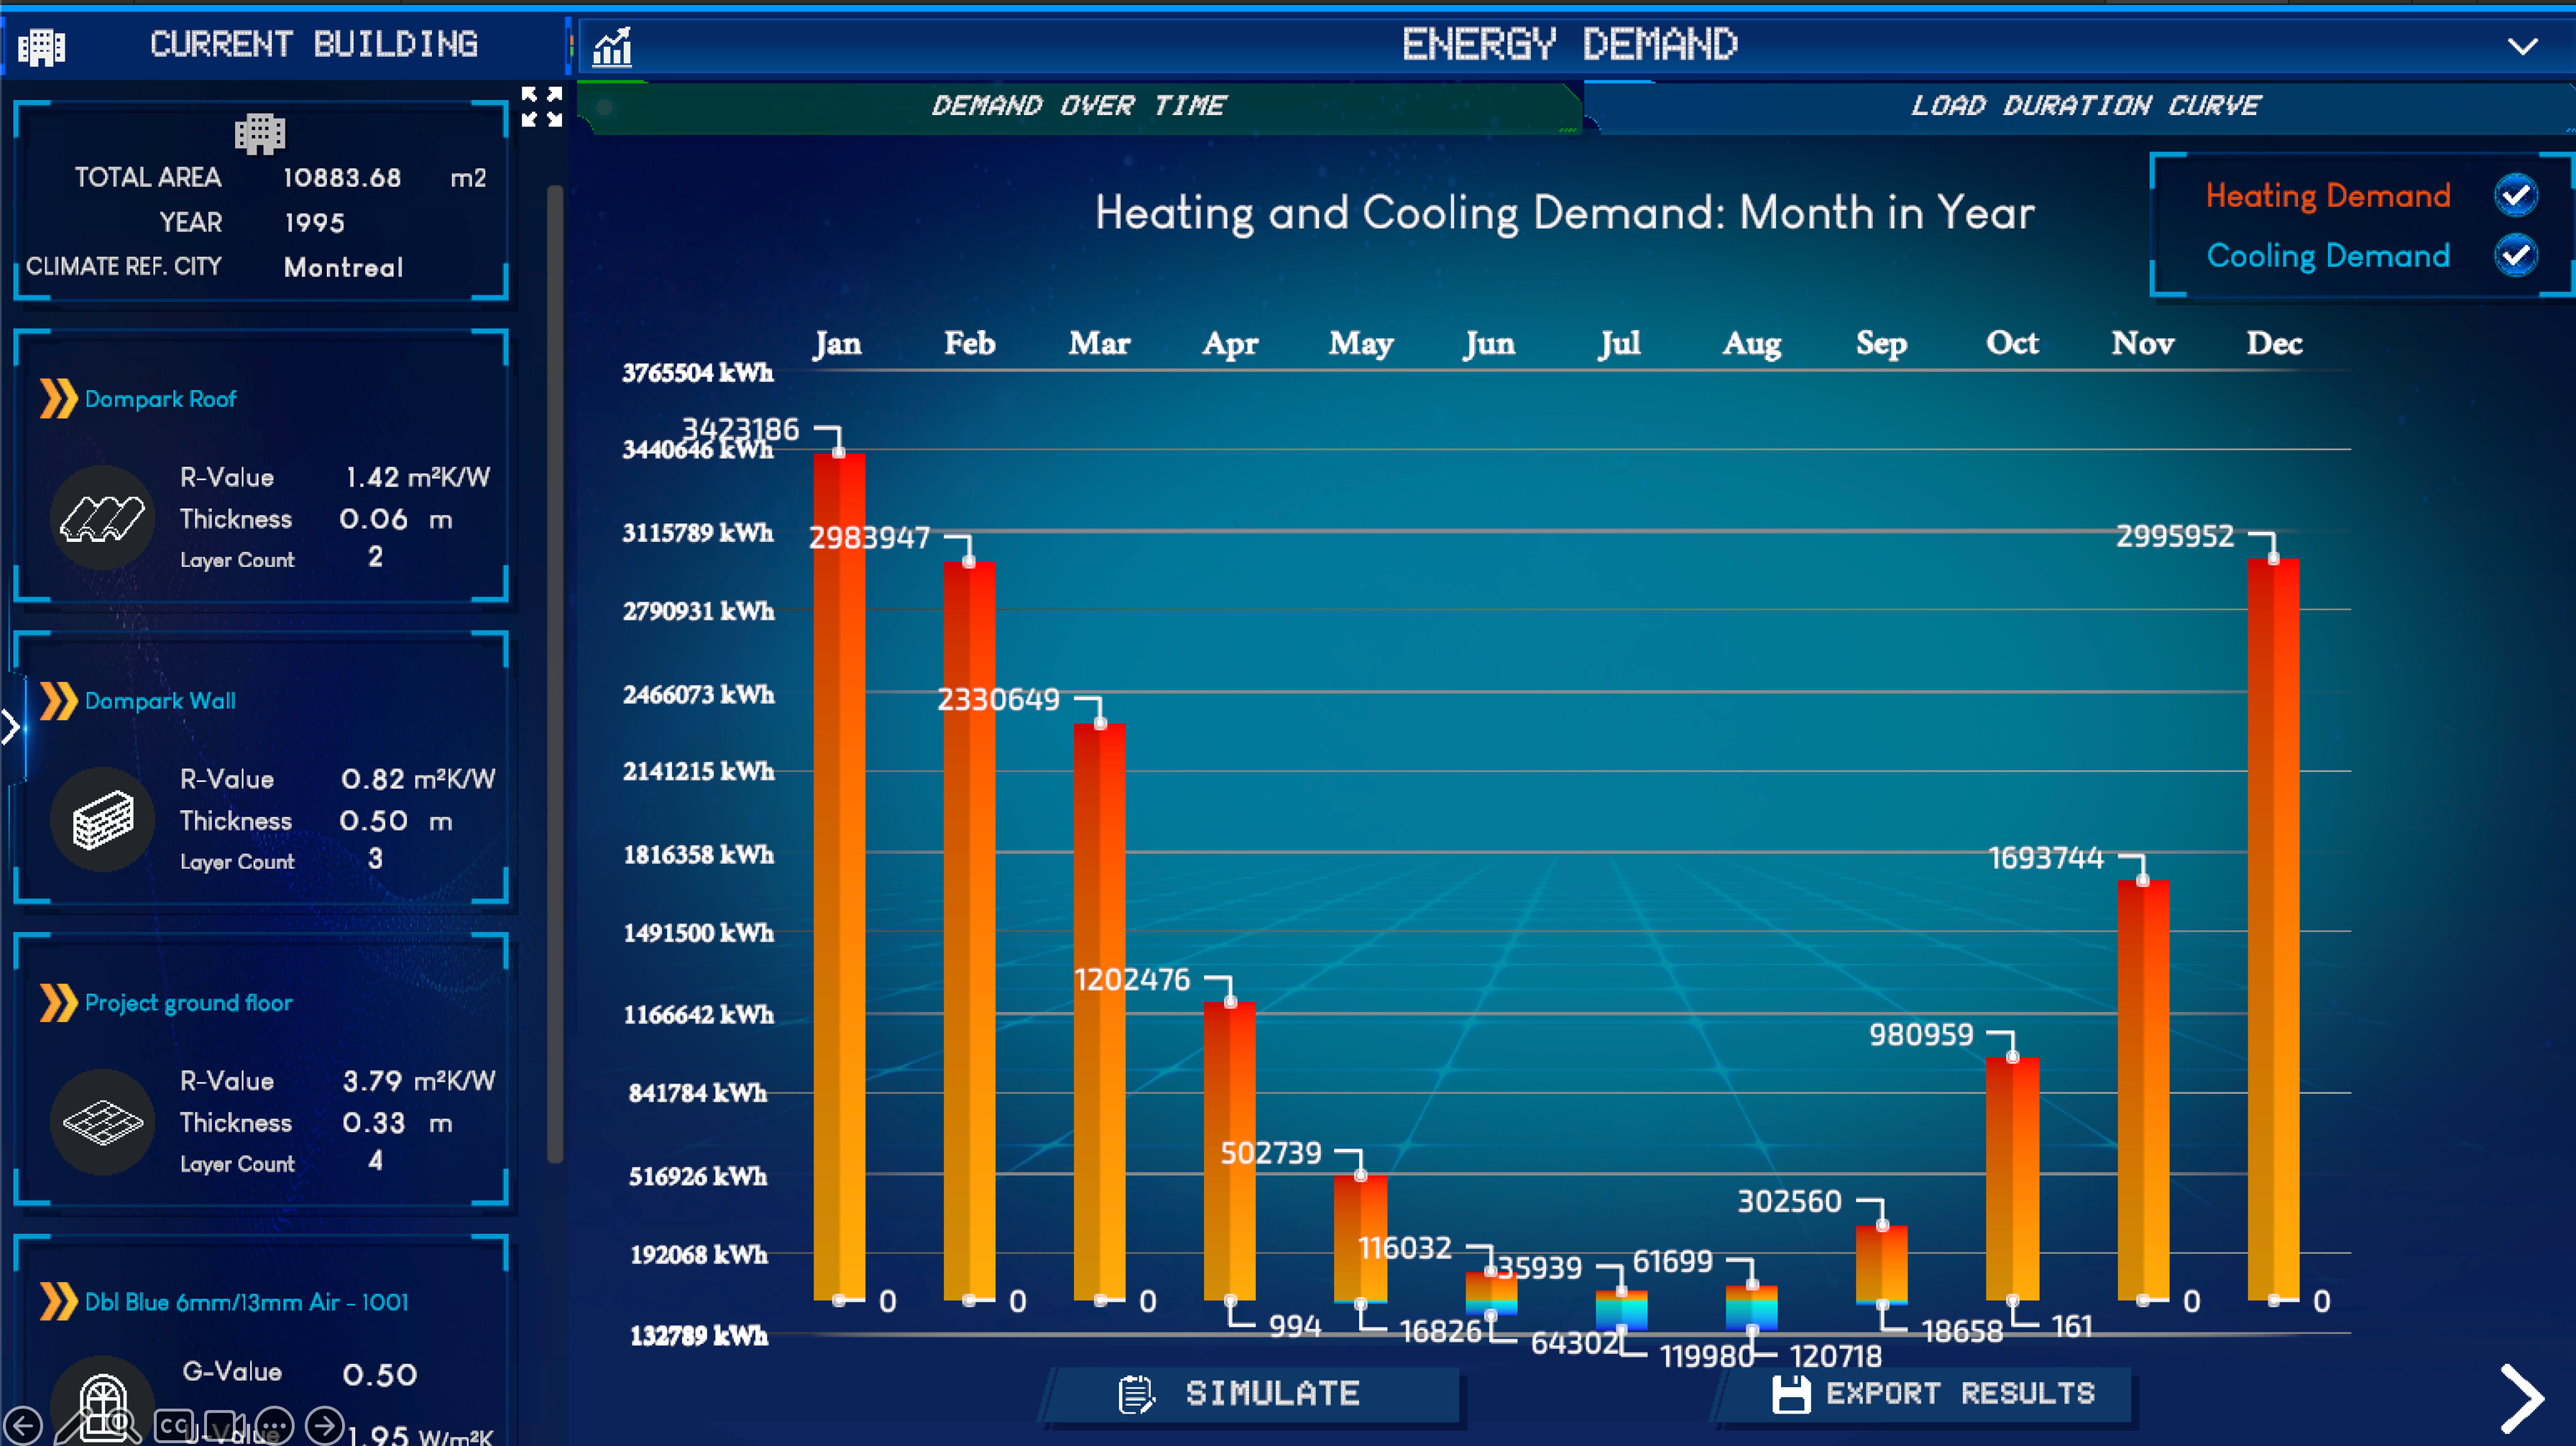
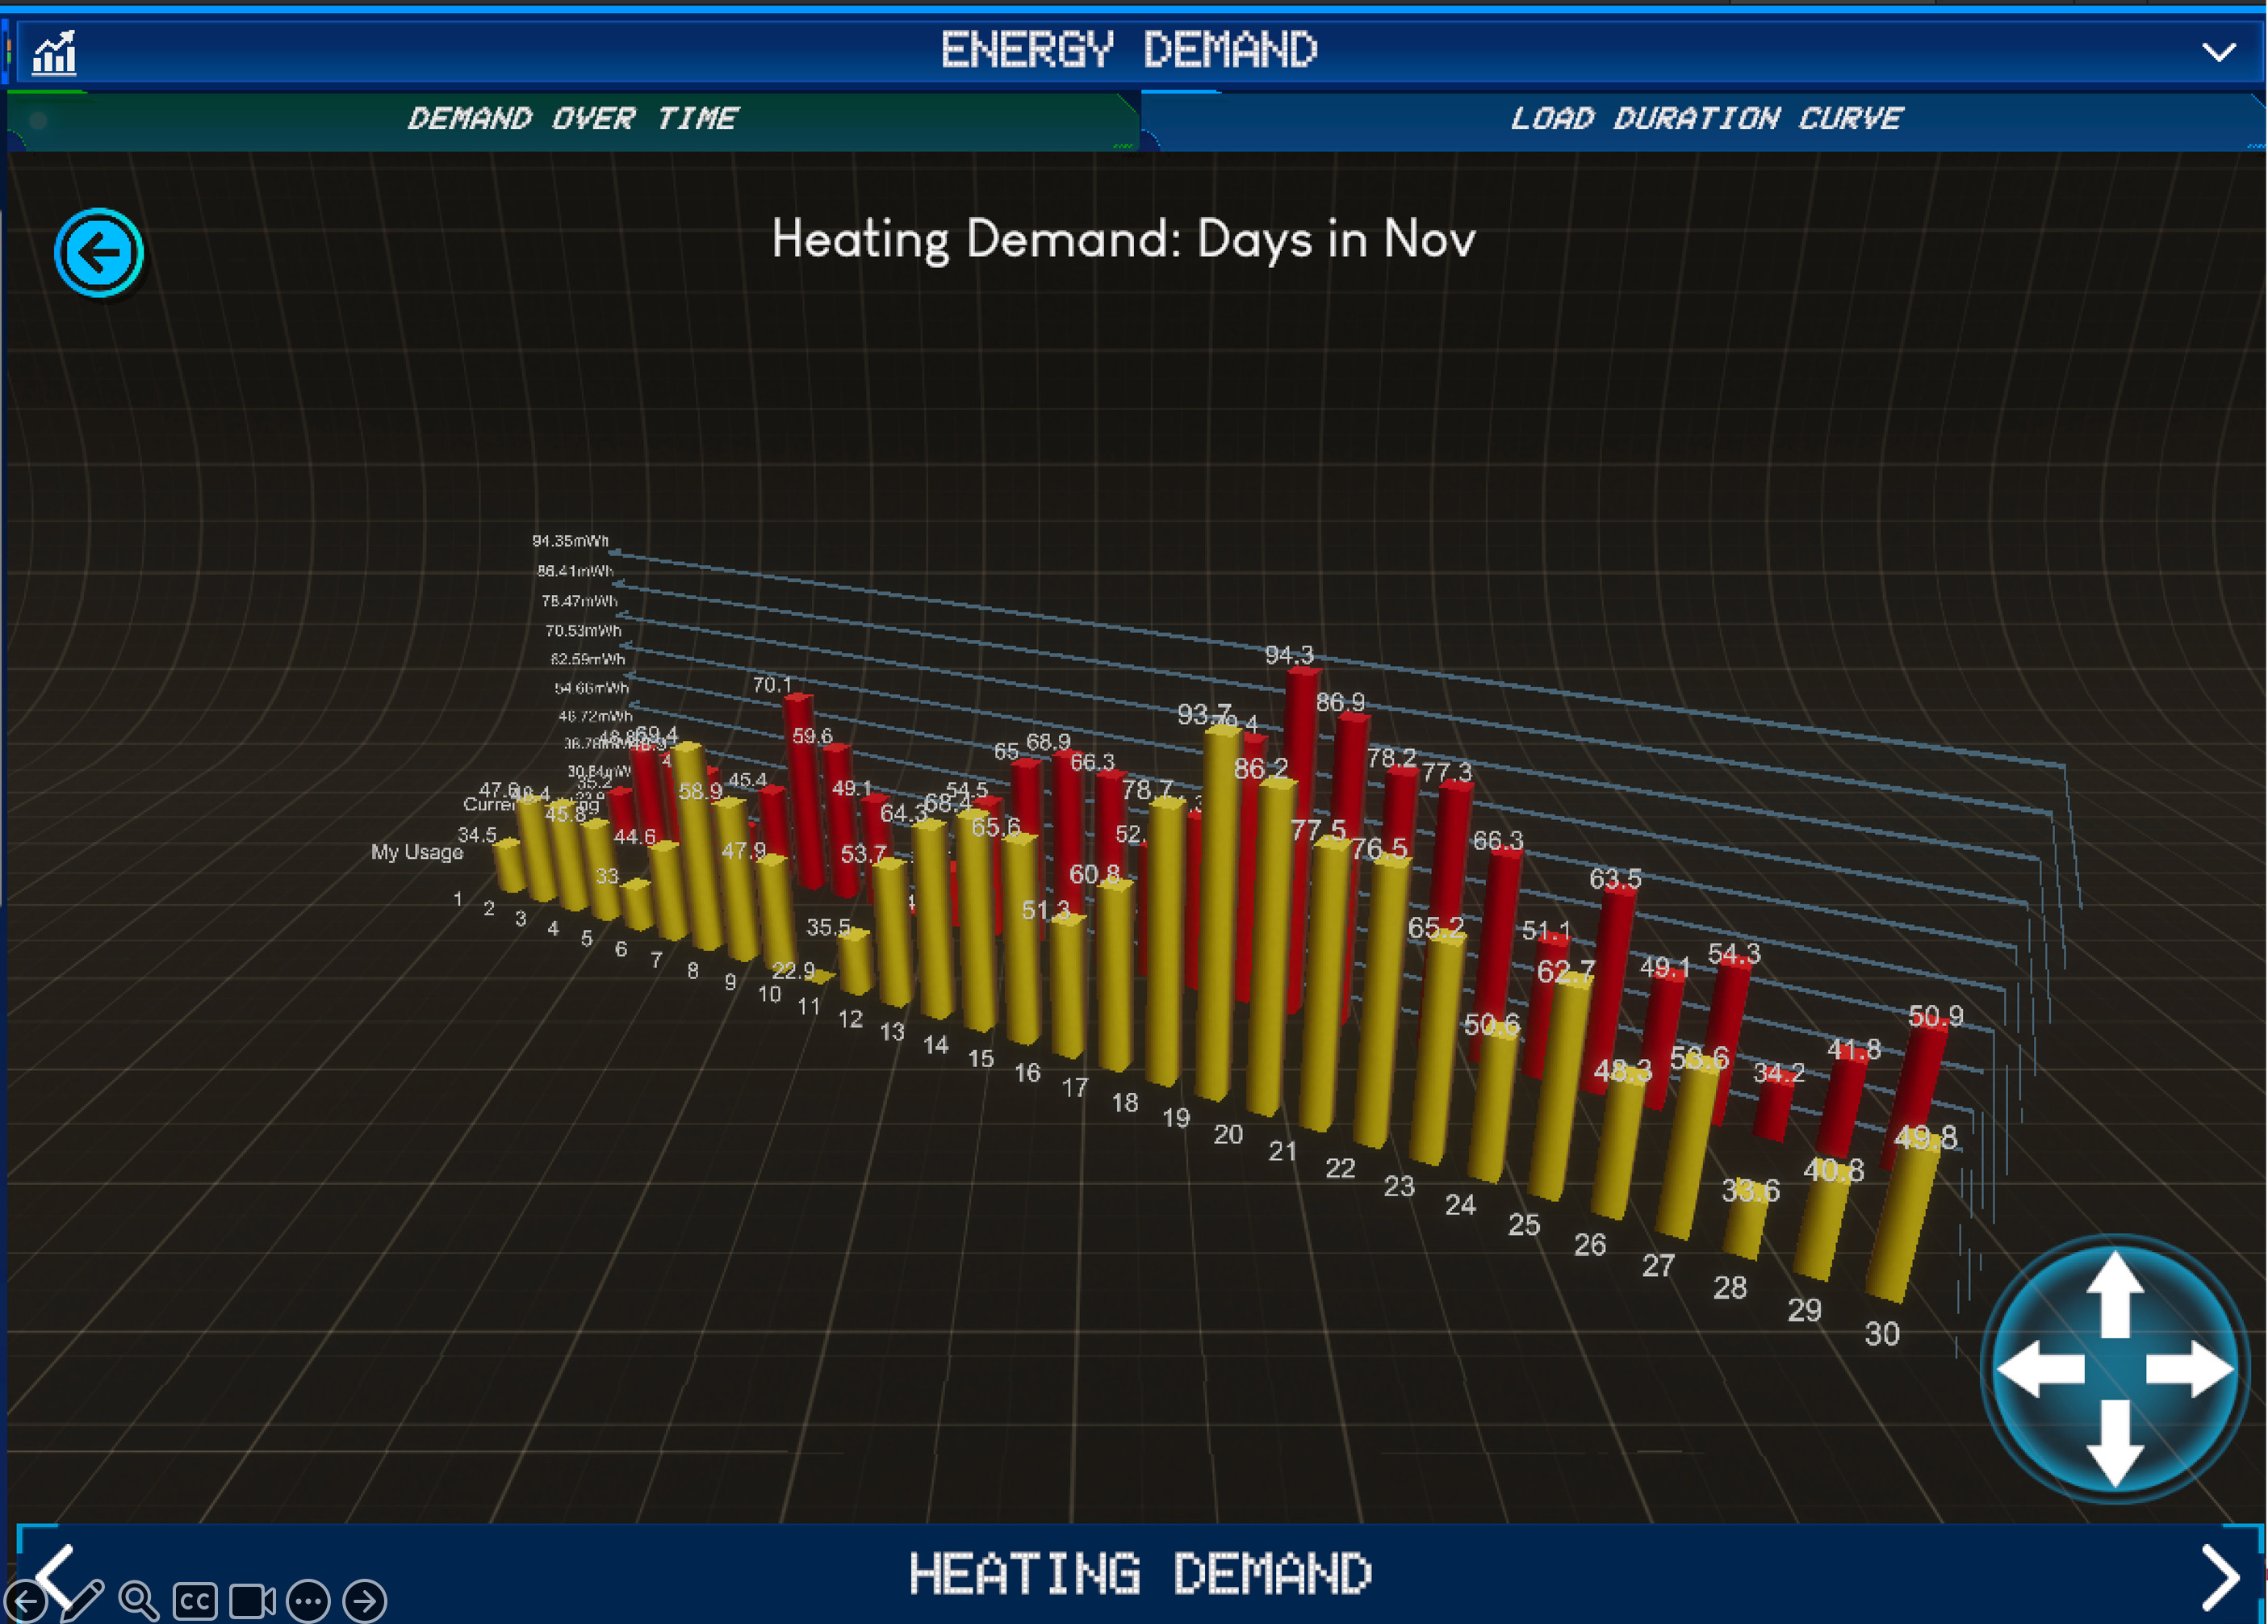
Interactive graph of monthly energy demand for heating and cooling
Once the user has completed all the required modifications to the building, they can then switch to the simulation screen where a real-time simulation can be run of the energy profile of the building over a 12-month period. This uses the CITYhub (which in turn uses Energy Plus) and, depending on the complexity of the building geometry, may take a few minutes. The results are the hourly energy demand for a full year, broken into demand for heating, cooling, lighting, and appliances. The results are shown on a clear, interactive 3D graph. The user can quickly switch from monthly to daily to hourly just by clicking directly on the data bars themselves.
Another graph can be displayed showing the peak energy load profile – an important metric when considering sizing a heat pump system. In the full version, there will also be graphs to show the energy consumption, operational CO₂eq emissions, and life-cycle costs of the retrofitted building.
Scenario Manager
Side-by-side comparison of different retrofit scenarios
The user can name a scenario and save it. The scenario management screen allows the user to manage many different retrofit scenarios for each building and, importantly gives the ability to compare them. Up to three scenarios can be loaded at once and the user can see their simulation graphs side-by-side in order to quickly compare them at a detailed level.
Current state of the project
The RETROfitter is no longer in active development. Some of its building retrofit features are now incorporated into CITYlayers Single-Building and Multi-Building retrofit services. Some of the assets and mechanics shown in the RETROfitter are now part of CITYplayer.